File:Fukushima2011july18a.jpg
Original file (735 × 900 pixels, file size: 232 KB, MIME type: image/jpeg)
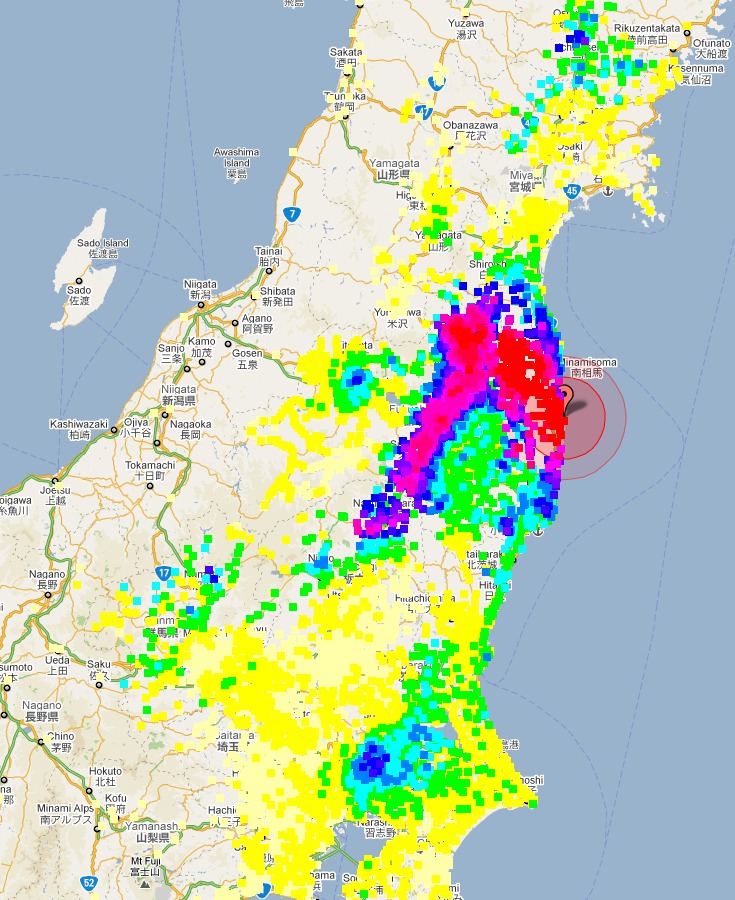
![]() Map of contamination attributed to the Fukushima disaster, image from
http://www.nnistar.com/gmap/fukushima.html
Map of contamination attributed to the Fukushima disaster, image from
http://www.nnistar.com/gmap/fukushima.html
state for July 18, 2011, and the scale.
The scale looks strange. For example,
the dense yellow may correspond to 0.2 $\mu$Sv/h, see the bottom row, as well as 2 $\mu$Sv/h, the upper row.
the blue may correspond to 0.6 $\mu$Sv/h, see the bottom row, as well as 0.1 $\mu$Sv/h, the upper row.
If the authorities cannot draw the unambiguous map of contamination, there is no reason to expect that they can handle a nuclear power plant in a safe way. While they have problem with assigning colors to the levels, the four levels (for example 0.1, 1, 10 and 100 $\mu$Sv/h) would be better solution, than the irregular mixture of the tens of colors.
File history
Click on a date/time to view the file as it appeared at that time.
| Date/Time | Thumbnail | Dimensions | User | Comment | |
|---|---|---|---|---|---|
| current | 17:50, 20 June 2013 | | 735 × 900 (232 KB) | Maintenance script (talk | contribs) | Importing image file |
You cannot overwrite this file.
File usage
The following page uses this file: