Difference between revisions of "File:Image-202028-galleryV9-ehmb.jpg"
(Importing image file) |
|||
| Line 1: | Line 1: | ||
| + | Map of radioactive contamination for 2011 April 7 by Der Spiegel, |
||
| − | Importing image file |
||
| + | http://www.spiegel.de/international/world/bild-756647-202028.html |
||
| + | |||
| + | Numbers indicate the levels of radiation in microsievert/hour |
||
| + | |||
| + | At the reuse, please, attribute the article in [[Der Spiegel]] |
||
| + | <ref name="der"> |
||
| + | http://www.spiegel.de/international/world/0,1518,756647,00.html |
||
| + | Alexander Osang. In the Shadow of Fukushima. 04/14/2011. |
||
| + | </ref> |
||
| + | |||
| + | The map indicates that the decision of the Japanese government about circular zones of the evacuation may be not best: some reasons (in particular, 30km to the North or 30km to the West from Fukushima) may be not so urgent to evacuate; while the regions to North–West from Fukushima may require the evacuation even if they are out of the 50km evacuation zone declared. |
||
| + | |||
| + | [[File:Si-radiation-thumb-200xauto-6005b.jpg|right|300px]] |
||
| + | The same conclusions can be done on the aerial measurements map |
||
| + | <ref name="kaiser"> |
||
| + | http://news.sciencemag.org/scienceinsider/2011/04/a-map-of-fukushimas-radiation.html?ref=hp Jocelyn Kaiser. A Map of Fukushima's Radiation Risks. 22 April 2011, 11:17 AM. |
||
| + | </ref> by the U.S. Department of Energy prepared within the [[plan Tomodachi]] of collaboration between Japan and the USA, shown at right |
||
| + | |||
| + | ==References== |
||
| + | <references/> |
||
| + | |||
| + | [[Category:Fukushima disaster]] |
||
| + | [[Category:Nuclear accidents]] |
||
| + | [[Category:Contaminaiton maps]] |
||
| + | [[Category:Maps]] |
||
Latest revision as of 09:38, 21 June 2013
Map of radioactive contamination for 2011 April 7 by Der Spiegel, http://www.spiegel.de/international/world/bild-756647-202028.html
Numbers indicate the levels of radiation in microsievert/hour
At the reuse, please, attribute the article in Der Spiegel [1]
The map indicates that the decision of the Japanese government about circular zones of the evacuation may be not best: some reasons (in particular, 30km to the North or 30km to the West from Fukushima) may be not so urgent to evacuate; while the regions to North–West from Fukushima may require the evacuation even if they are out of the 50km evacuation zone declared.

The same conclusions can be done on the aerial measurements map [2] by the U.S. Department of Energy prepared within the plan Tomodachi of collaboration between Japan and the USA, shown at right
References
- ↑ http://www.spiegel.de/international/world/0,1518,756647,00.html Alexander Osang. In the Shadow of Fukushima. 04/14/2011.
- ↑ http://news.sciencemag.org/scienceinsider/2011/04/a-map-of-fukushimas-radiation.html?ref=hp Jocelyn Kaiser. A Map of Fukushima's Radiation Risks. 22 April 2011, 11:17 AM.
File history
Click on a date/time to view the file as it appeared at that time.
| Date/Time | Thumbnail | Dimensions | User | Comment | |
|---|---|---|---|---|---|
| current | 17:50, 20 June 2013 | 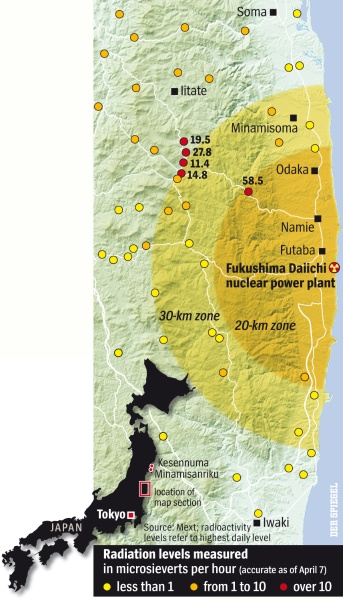 | 343 × 600 (88 KB) | Maintenance script (talk | contribs) | Importing image file |
You cannot overwrite this file.
File usage
There are no pages that use this file.