Difference between revisions of "File:NISAdoe1.jpg"
Jump to navigation
Jump to search
(Importing image file) |
|||
| Line 1: | Line 1: | ||
| + | Map of contamination after the [[Fukushima disaster]] |
||
| − | Importing image file |
||
| + | for 2011 Mar 27-28 by |
||
| + | |||
| + | http://blogs.nature.com/news/thegreatbeyond/2011/03/fukushima_update_against_the_o_1.html |
||
| + | |||
| + | ==Compatibility with other data== |
||
| + | Some other data indicate the level of radiation in $\mu$Sv/hour |
||
| + | |||
| + | In order to compare, see http://en.wikipedia.org/wiki/Sievert ; according to wikipedia, |
||
| + | |||
| + | 1 rem = 0.01Sv = 10 msV |
||
| + | |||
| + | As I understand, 1 mR/hr= 10$\mu$sV/hour ; id est, roughly, multiply the number with factor 10, and the result |
||
| + | will be in $\mu$Sv/hour |
||
| + | |||
| + | |||
| + | See also |
||
| + | |||
| + | File:NISAdoe2.jpg and |
||
| + | |||
| + | File:NISAdoe3.jpg |
||
| + | |||
| + | [[Category:Nuclear accidents]] |
||
| + | [[Category:Maps]] |
||
Latest revision as of 09:38, 21 June 2013
Map of contamination after the Fukushima disaster for 2011 Mar 27-28 by
http://blogs.nature.com/news/thegreatbeyond/2011/03/fukushima_update_against_the_o_1.html
Compatibility with other data
Some other data indicate the level of radiation in $\mu$Sv/hour
In order to compare, see http://en.wikipedia.org/wiki/Sievert ; according to wikipedia,
1 rem = 0.01Sv = 10 msV
As I understand, 1 mR/hr= 10$\mu$sV/hour ; id est, roughly, multiply the number with factor 10, and the result will be in $\mu$Sv/hour
See also
File:NISAdoe2.jpg and
File:NISAdoe3.jpg
File history
Click on a date/time to view the file as it appeared at that time.
| Date/Time | Thumbnail | Dimensions | User | Comment | |
|---|---|---|---|---|---|
| current | 17:50, 20 June 2013 | 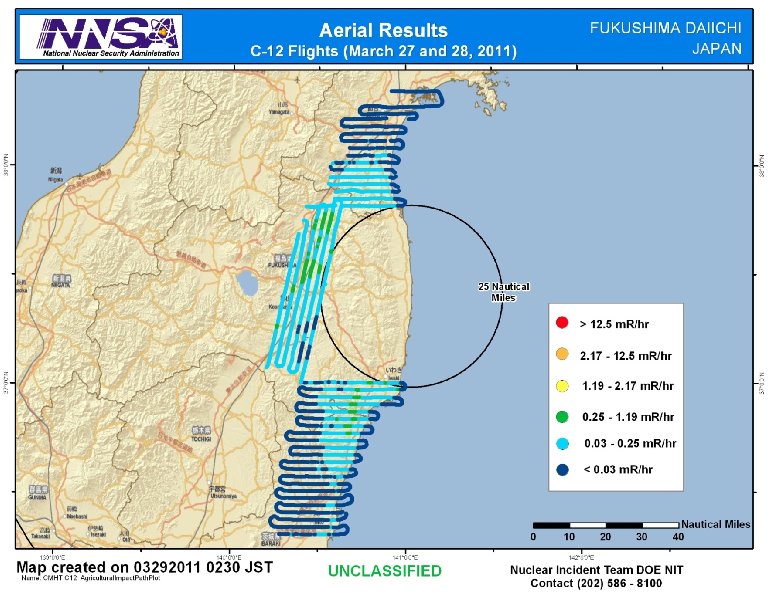 | 769 × 595 (108 KB) | Maintenance script (talk | contribs) | Importing image file |
You cannot overwrite this file.
File usage
There are no pages that use this file.